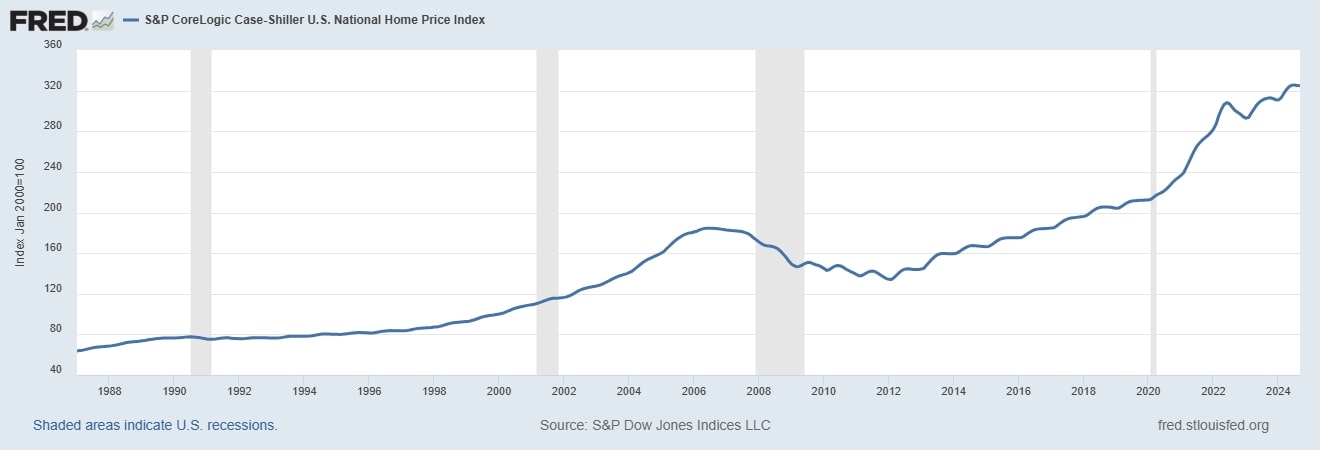
The latest release of the S&P CoreLogic Case-Shiller Indices highlights a 3.9% growth in home prices, marking a slight cooling from the previous month’s 4.3%. This shift signals the end of a streak of record-setting gains in the national index and may hint at a sustained slowdown in price increases. For prospective buyers, a gradual deceleration in prices, paired with the potential for lower mortgage rates in 2025, could signal improving market opportunities.
As a trusted barometer for U.S. housing trends, this index offers invaluable insights for policymakers, economists, and real estate professionals assessing market conditions. While the data through September 2024 provides a snapshot of national and metropolitan housing health, it also serves as a reminder of the rapid pace of economic change that can render trends outdated almost overnight.
For Hawaii, where the housing market is uniquely shaped by both global influences and local nuances, understanding these trends is very important. In the following, we’ll break down the September Case-Shiller Index report and compare it with local data from the Big Island. This side-by-side look will provide a clearer picture of how national trends align—or differ—from the unique dynamics of our island market.
Key Takeaways from the Case-Shiller Index
(NOV 26 2024 Press Release)
:

- Annual Growth Slows
- The U.S. National Home Price NSA Index rose by 3.9% annually in September 2024, down from 4.3% in August.
- The 10-City and 20-City Composites posted year-over-year increases of 5.2% and 4.6%, respectively, marking a slight slowdown.
Kona, Hawaii Context:
- Single-family homes and condos experienced slower gains compared to August, increasing by 0.3% and 3.9%, respectively.
- Despite the slowdown, median prices remain higher year-over-year, reflecting resilience in Kona’s real estate market.
- Regional Variations
New York led annual growth with a 7.5% price increase, followed by Cleveland (7.1%) and Chicago (6.9%).- Denver showed the lowest growth among major cities at 0.2%.
Kona, Hawaii Median Prices (Annual Change as of September 30, 2024):
- Single-family homes: +10.2%
- Condominiums: +17.2%
Hawaii’s real estate market, especially on the Big Island, continues to outperform many U.S. urban markets.
- Monthly Trends
- Nationally, home prices declined by 0.1% (non-seasonally adjusted) but increased by 0.3% after seasonal adjustments.
- Similar trends were observed in the 10-City and 20-City Composites.
- Regional Performance Highlights
- The Northeast (+5.7%) and Midwest (+5.4%) showed strong annual growth, driven by robust urban markets.
- The South recorded its slowest growth in over a year, at 2.8%, aligning with current inflation rates.
- Historical Context
- Nationally, the U.S. Home Price Index is at an all-time high, up 75.9% from the 2006 peak and 142.4% from the 2012 trough.
Kona, Hawaii Historical Gains:
- From the 2006 peak:
- Single-family homes: +94.6%
- Condominiums: +60.5%
- From the 2012 trough:
- Single-family homes: +215.7%
- Condominiums: +244.0%
Hawaii’s performance remains consistently stronger than national averages, underlining its market’s unique appeal and resilience.
Analysis and Local Implications
Price growth slowed during Q3 2024 due to technical factors, yet long-term trends remain robust. The Northeast’s leadership reflects strong urban market dynamics, while the South’s slowdown mirrors regional adjustments.
In Kona, despite year-over-year median price increases for both condo and home, the prices have dipped slightly since September. These shifts emphasize that Hawaii is not immune from shifts happening in the broader US market.
Why This Matters in Hawaii
Real estate is inherently hyperlocal, but Hawaii’s market, especially on the Big Island, mostly depends on mainland buyers. Understanding broader economic trends provides valuable context, especially given that much of the available data lags by two to three months. Accurate comparisons—whether “apples to apples” or, in our case, “mangoes to mangoes”—are essential for making sound decisions.
At KE Team Hawaii, we combine national insights with local expertise, helping our clients navigate the unique challenges and opportunities of Big Island real estate.
Curious about how market trends affect your buying or selling goals? Contact us for tailored advice, or visit our website for more information.


